Roald Schrack
November 22, 1999
Overview
The following table shows the number of ballots cast and registration in the last
several elections.
| Year |
Ballots |
Registration |
B/R |
Previous Voters |
New Registration |
| 1991 |
5451 |
20,648 |
.26 |
7916 |
1741 |
| 1993 |
1449 |
23,077 |
.06 |
9889 |
4409 |
| 1995 |
4323 |
22,787 |
.19 |
8133 |
1317 |
| 1997 |
5211 |
22,660 |
.22 |
6968 |
3299 |
| 1999 |
4690 |
22,676 |
.21 |
6898 |
1451 |
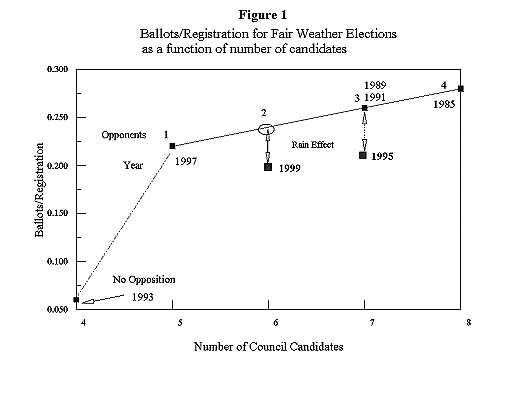
Although there are only small differences in the voting between 1997 and 1999 a few of
things were different in the two elections. In 1997 the incumbent Mayor and all 4
incumbent Council members ran and there was one Council challenger while in 1999 there was
an open seat on the council with 6 council candidates, three of them incumbents. Election
day in 1997 was mild and clear, while heavy rain persisted from noon until after 4:00 p.m.
on election day 1999. These two differences had opposite effects on the turnout.
The effect of the rain can be estimated from the relative number of absentee ballots
and polling place ballots. The following table shows absentee ballots and their ratio to
the polling place ballots for the last several elections.
| Year |
Absentee |
Absentee/Ballots Polling Place |
| 1989 |
175 |
.028 |
| 1991 |
168 |
.032 |
| 1993 |
48 |
.033 |
| 1995 |
180 |
.042 |
| 1997 |
156 |
.031 |
| 1999 |
171 |
.038 |
The average of Absentee Ballots/Polling Place Ballots for the last four non-rainy years
is .031, the ratio for 1995 is relatively high because the weather was rainy for most of
the day. If the same fraction of the voters voted by absentee ballot then the implication
is that the rain decreased the number of polling place voters by .31/.38= .82. If it had
been a clear day, 4519(polling place ballots)/.82= 5512 would have made it to the polls
making the voter participation 0.25 instead of 0.21. Figure 1 shows how weather and number
of council candidates determine the voter participation.
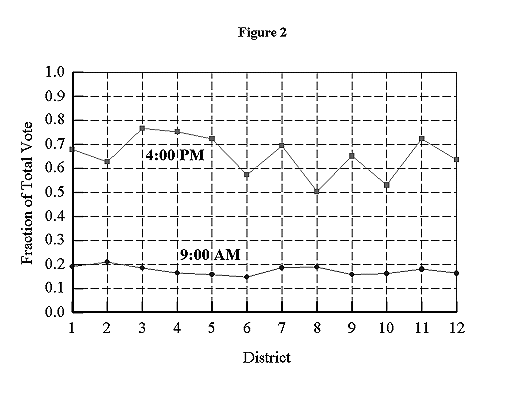
A record was kept of the number of ballots cast by 9:00am and by 4:00pm. Figure 2 shows
the fraction of the total vote at a district polling place for the two times. Note that
the variation is not very great at 9:00 am but is much greater at 4:00 p.m. Using this
data it was possible to predict the final total vote with 2% accuracy at 4:00 p.m. based
on similar records taken in 1997.
There are 12 voting districts in Rockville placed so that no voter has to travel far to
his/her polling place. The Districts have very different numbers of registered voters and
thus they have a different impact on the election. Figure 3 shows the total number of
registered voters for each district for the 1999 election. The way that the districts have
been chosen has led to an interesting side effect. Since the districts also reflect
varying demographic characteristics and economic factors, the voters make different
political decisions. In addition, changes in registration and voting reflect changes in
the characteristics of a neighborhood.
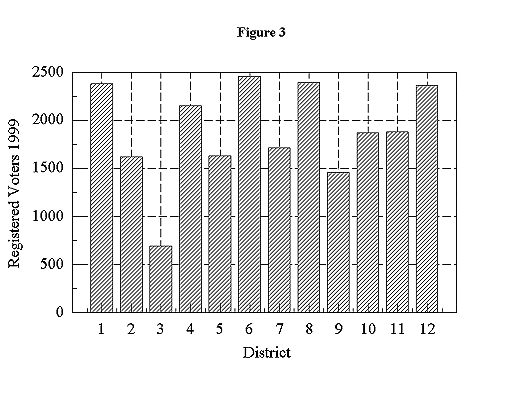
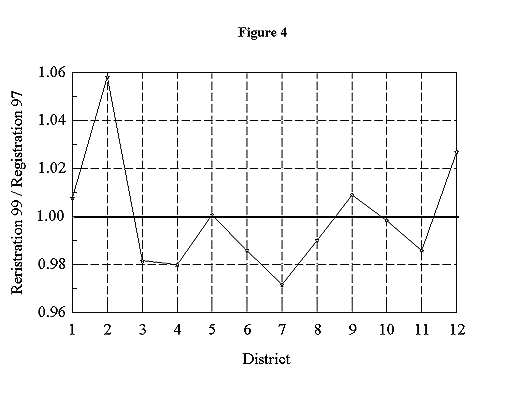
Figure 4. Shows the change in the number of registered voters from 1997 to 1999. The 6%
increase in registration in District 2 is too large to be a random statistical
fluctuation.
The growth in registration in district 2 is due in large part to the construction of
new homes near Dogwood Park and the reconstruction of the Blandford Street apartments. In
other districts the addition of new residents was offset by the departure of the previous
residents of the existing housing.
District Comparisons
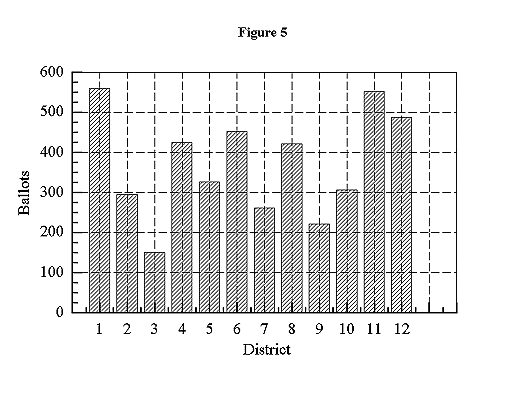
Figure 5 shows the total vote in each district in the 1999 election. Note that the vote
varies by almost a factor of four. Comparison to Figure 3 will show that districts with
low total vote may have higher than average participation (ballots/ registered voters).
This comparison is shown explicitly in Figure 6.
In Figure 6, the relative voter participation is shown for 1997 and 1999 elections.
Note that the participation in districts 5, 8, 9, and 12 dropped. This is probably related
to the support in those districts for Mr. Haughey in the 1997 election. Note that District
11 has a consistently high participation. District 11 has the New Mark Commons subdivision
in it.
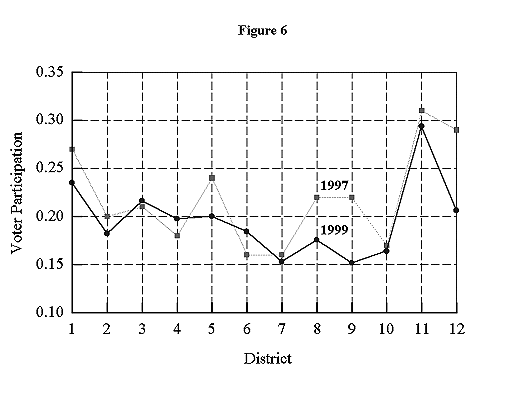
If New Mark Commons is removed from the district the participation would be about 0.17,
similar to districts 7, 8, 9, or 10. Participation by New Mark Commons residents is a
remarkable 0.72. This no doubt related to the fact that the Mayor is also the
Administrator of the New Mark Commons Homeowner's Association. It will be interesting to
see how participation is affected when the Mayor is no longer a candidate for elected
office in Rockville. It is, of course, a great tribute to the Mayor that those who know
best of her administrative ability are the most enthusiastic about her candidacy.
Candidates
The coverage of the race by the Rockville Gazette was quite good with separate articles
on the different candidates and a voters guide type insert the week before the election.
The city cable channel gave time to all candidates for a short statement and the city
newsletter had a n election insert that reproduced the candidate statements. The Alliance
of Rockville Citizens issued a newsletter which gave uniform coverage to all candidates.
The newsletter was reproduced on Rocknet, the community internet page. In addition there
were four community forums where the candidates could be questioned directly by the
public. The electorate was well informed about the candidates from a multitude of sources.
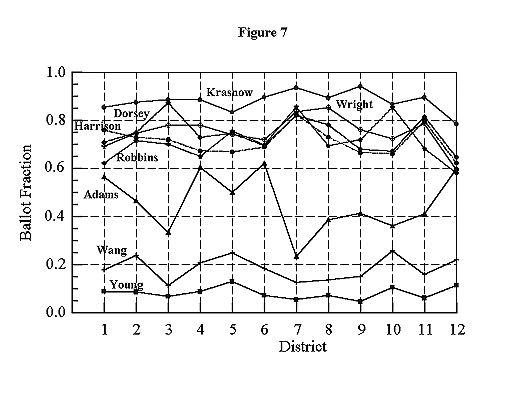
Figure 7 shows the fraction of the total votes in a district received by each
candidate. Rose Krasnow, the candidate for mayor, clearly led the race, receiving more
votes than any council candidate in every district. The support for her opposition, Lih
Young dropped from 619 votes in 1997 to 387 in 1999. The candidates that ran with Krasnow
on the Committee for Rockville's Future slate ( Bob Dorsey, Glennon Harrison, Anne
Robbins, and Bob Wright) received from 69% to 74% of the vote as compared to Krasnow's 87%
of the vote. Charlie Adams and Eric Wang, newcomers to Rockville politics , trailed with
48% of the voters giving one of their four council ballots to Adams and 19% to Wang. As
might be expected , there was a strong anti-correlation to the vote for Robbins and the
vote for Adams. Where the graph is hard to read please refer to the tabulated results.
Not shown in Figure 7 is the number of blank ballots. In the race for Mayor there were
only 206 blank ballots out of a total of 4690 or 4%. In the Council race each voter has
the right to make four selections. In the 1997 election there was a great deal of
"bullet balloting" where a voter chose to use only one of his council votes in
an attempt to boost the chance of election for a single council candidate. In that race
the missing ballot fraction was 1.3 in District 12. This result could be achieved if about
half the voters in District 12 voted for only one council candidate. Note that again in
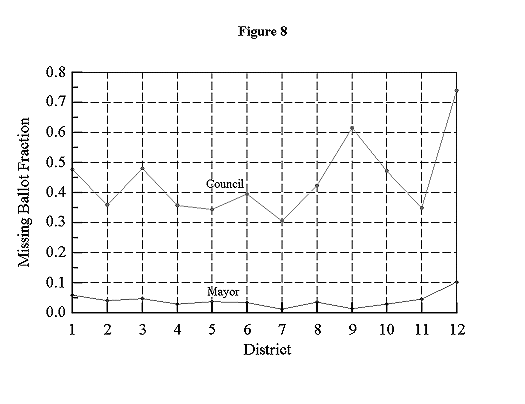
the 1999 race that district 12 has the largest missing ballot fraction. There does not
seem to be a strong correlation of the missing ballot fraction with any particular
candidate in the rest of the districts and as far as is known, none of the candidates
asked their supporters to "bullet ballot" for them.
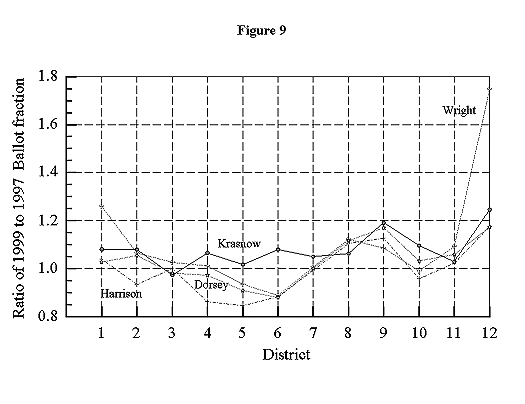
Because of the rain fewer votes were cast in 1999 than in the 1997 election. The
incumbents obtained a greater fraction of voter support than they did in 1997. Figure 9
shows the gains made by the incumbents over their support fraction in the 1997 election.
Averaged over all districts the relative gains were:
| Krasnow |
1.05 |
| Dorsey |
1.01 |
| Harrison |
.98 |
| Wright |
1.07 |
Correlations
The district correlation analysis shows the degree to which the pattern of votes for
the candidates in the 12 districts is similar. Some candidates have particularly strong
support in a particular district that is not shared by the other candidates, this reduces
their correlation coefficient. The candidates whose vote patterns are most similar are
Krasnow and Wright. The correlation values for Young and Wang are not included because
they were they were so low. Only the upper half of the table is shown, the lower half is
identical.
| |
Krasnow |
Adams |
Dorsey |
Harrison |
Robbins |
Wright |
| Krasnow |
1 |
0 |
.42 |
.54 |
.51 |
.77 |
| Adams |
|
1 |
0 |
0 |
0 |
0 |
| Dorsey |
|
|
1 |
.71 |
.20 |
.71 |
| Harrison |
|
|
|
1 |
.25 |
.62 |
| Robbins |
|
|
|
|
1 |
.48 |
| Wright |
|
|
|
|
|
1 |
Charlie Adams vote pattern was anti-correlated with all other candidates. His
supporters , in general, were distributed in a different pattern in the city than those he
ran against. The following table shows the anti-correlation values for Adams in relation
to the other candidates.
| Krasnow |
Dorsey |
Harrison |
Robbins |
Wright |
| .58 |
.60 |
.54 |
.71 |
.65 |
The slightly higher anti-correlation for Robbins indicates that Adams supporters were
less likely to give one of their 3 remaining votes to Robbins than one of the incumbents.